
Retirement savings benchmarks can answer a question almost everyone asks: Am I ahead, behind or somewhere in the middle?
The answer can be useful, but only if you understand what the benchmark measures.
A salary multiple such as “six times income by age 50” is a quick checkpoint built on assumptions about when saving began, how much was saved, investment returns, retirement age and future spending. It does not know your pension, Social Security, mortgage, healthcare, retirement date or desired lifestyle.
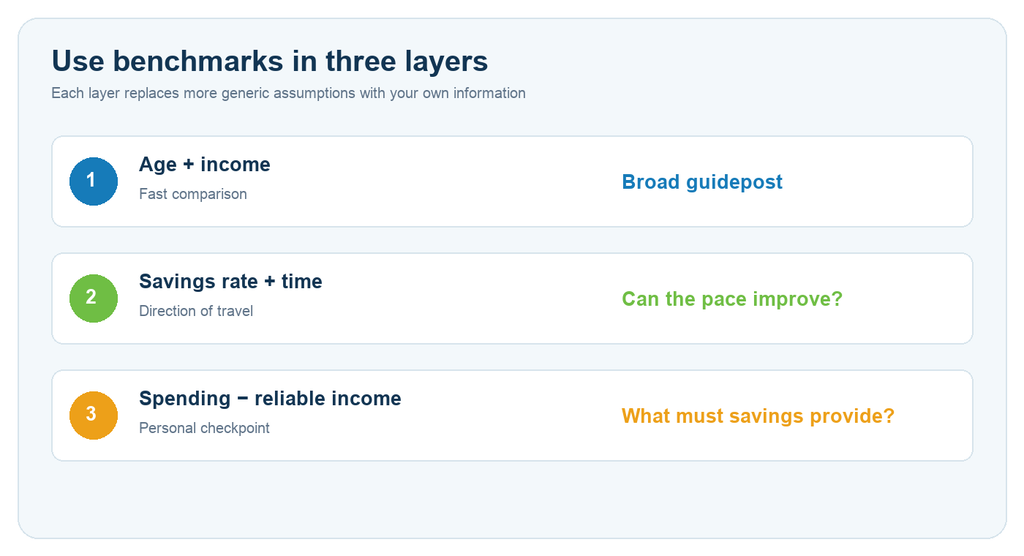
Use benchmarks in three layers:
- Age-and-income benchmark: a fast comparison with a general path.
- Savings-rate benchmark: whether your current contributions are moving the number in the right direction.
- Personal spending benchmark: the savings your own retirement income gap may require.
The third layer matters most. The first two help you find questions to investigate.
Key takeaways
- Salary-multiple benchmarks, such as six times income by 50, are quick checkpoints built on general assumptions.
- Divide your retirement savings by your yearly household income to find your own multiple.
- Being behind a benchmark does not mean you cannot retire; a pension, lower spending or working longer can change the picture.
- Your own spending gap matters more than any published benchmark.
Step 1: Calculate your current savings multiple
Add the accounts and investments you intend to use for retirement:
- 401(k), 403(b), 457 and similar workplace accounts
- Traditional and Roth IRAs
- SEP, SIMPLE and other self-employed retirement accounts
- Taxable investments designated for retirement
- Cash reserved for long-term retirement spending
Then divide the total by current annual household income:
Retirement savings ÷ annual income = current savings multiple
If you have $450,000 saved and household income is $100,000:
$450,000 ÷ $100,000 = 4.5 times income
Do not automatically include home equity unless your retirement plan uses it through a sale, move or other specific strategy. Also avoid comparing one spouse’s retirement balance with total household income while leaving the other spouse’s savings out.
Step 2: Compare with more than one published benchmark
Fidelity’s guideline suggests at least 1× income by age 30, 3× by 40, 6× by 50, 8× by 60 and 10× by 67. Fidelity says the path assumes saving 15% of income annually beginning at 25, including employer contributions, retiring at 67 and maintaining a similar lifestyle.
T. Rowe Price publishes ranges rather than one point. Its approximate midpoints progress from 0.5× income at 30 to 5× at 50, 9× at 60 and 11× at 65. Its ranges widen with age because income and household circumstances create very different needs.
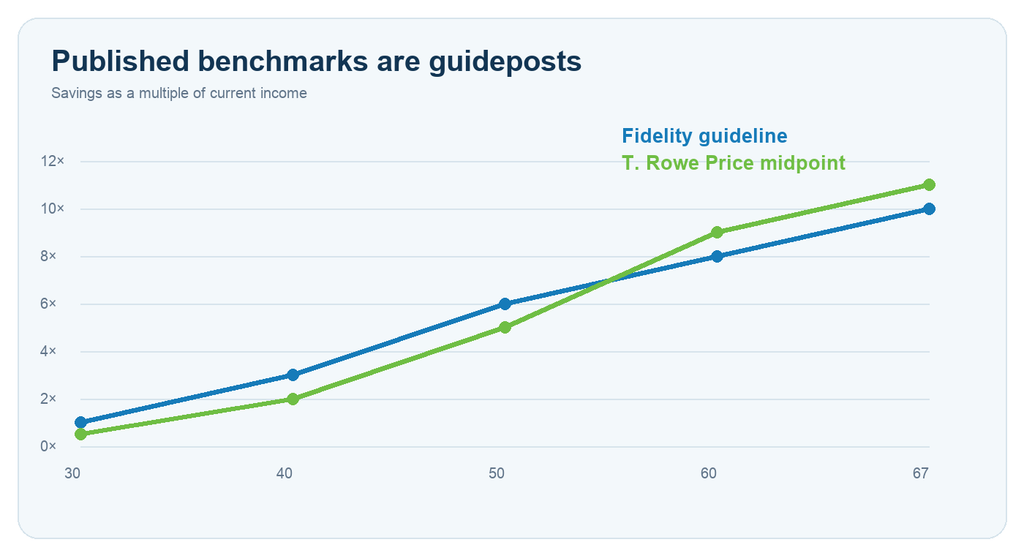
Different results do not mean one firm found the universal correct number. They reflect different assumptions and modeling choices. Treat the values as a neighborhood, not a finish line.
Step 3: Read “behind” correctly
Being below a general benchmark does not prove that you cannot retire. It says your current savings are below the path implied by that benchmark’s assumptions.
Your personal need may be lower if:
- A pension covers a meaningful share of spending.
- Your planned retirement spending is below your current income.
- Housing costs will fall through a concrete payoff or move.
- Social Security replaces a larger share of income.
- You plan to work longer than the benchmark assumes.
Your need may be higher if:
- You want to retire earlier.
- You expect higher retirement spending.
- Reliable income begins years after retirement.
- Healthcare, family support or housing costs are substantial.
- Much of the apparent wealth is unavailable for spending.
The correct response to “behind” is not panic. It is to replace the generic assumptions with your own numbers.
Step 4: Measure your savings rate
Divide annual contributions, including employer match, by annual income:
Annual contributions ÷ annual income = savings rate
$15,000 of contributions on $100,000 of income is a 15% savings rate.
This percentage shows pace, not readiness. Someone who started late may need a higher rate. Someone with a pension or already-large balance may need less. Debt, emergency savings and near-term cash needs also matter.
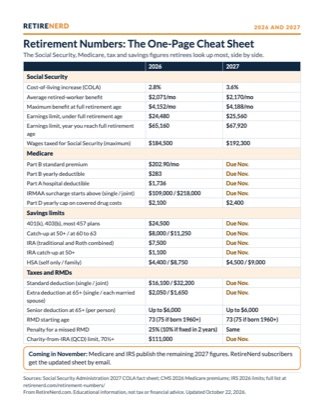
For 2026, the IRS says the employee contribution limit for many 401(k), 403(b), governmental 457 plans and the federal Thrift Savings Plan is $24,500. The general age-50 catch-up limit is $8,000, and eligible participants ages 60 through 63 have an $11,250 catch-up limit. The combined traditional and Roth IRA limit is $7,500, or $8,600 at age 50 or older, subject to compensation and eligibility rules.
These are legal ceilings, not recommendations. Use them to understand available room after deciding what your plan and cash flow support.
Step 5: Project the current path
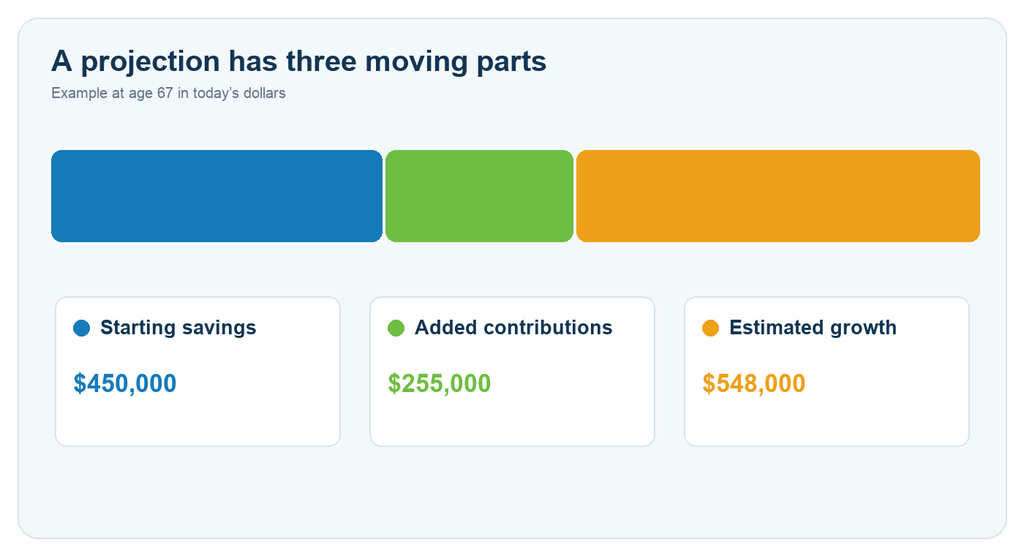
A present-day multiple does not show where you are headed. Project current savings plus future contributions to the intended retirement age.
Use more than one real return assumption, meaning return after inflation. A lower case helps reveal whether the plan depends on strong markets. A middle case gives a planning estimate. A higher case can show range without becoming the only acceptable outcome.
Suppose a 50-year-old has:
| Input | Amount |
|---|---|
| Current savings | $450,000 |
| Annual contributions | $15,000 |
| Years to age 67 | 17 |
| Assumed real return | 4% |
With annual contributions at year-end, the simplified projection reaches approximately $1.25 million in today’s dollars. This is not a forecast; it is a consistent way to test the current direction.
Step 6: Build the benchmark that belongs to you
Estimate annual retirement spending, then subtract Social Security, pensions and other reliable income:
Annual spending − annual reliable income = amount savings need to provide
If planned spending is $70,000 and reliable income is $35,000, the portfolio gap is $35,000 a year.
A simplified portfolio checkpoint divides that gap by a starting withdrawal rate:
$35,000 ÷ 4% = $875,000
This means $875,000 multiplied by 4% produces a $35,000 first-year withdrawal. It does not guarantee the money will last. Taxes, inflation, fees, investment mix, longevity, healthcare and the order of market returns still matter.
This personal checkpoint can differ sharply from an income multiple. That is useful. It shows which assumptions are creating the difference.
Step 7: Find the reason for the gap
If projected savings are below the spending-based checkpoint, identify the cause before choosing the fix.
The spending estimate is incomplete or too high
Build a retirement budget with essential, flexible and irregular costs. Include healthcare, taxes, repairs, travel and vehicle replacement. Reduce spending only when the change is realistic.
Reliable income starts later
Retirement and Social Security claiming do not have to begin together. Model the bridge years separately. Savings may carry more of the spending before benefits begin.
Contributions are too low
Test a specific increase per paycheck. Include employer match and redirect payments when debt ends. Avoid assuming an unrealistic return will repair the shortfall.
The retirement date is doing too much damage
One additional year can add contributions, allow more growth, shorten the withdrawal period and change Social Security estimates. Test one year at a time.
Debt is inflating the target
A permanent $600 monthly payment requires $7,200 of annual cash flow. At a 4% simplified checkpoint, that corresponds to $180,000 of portfolio need. Compare payoff costs, taxes and liquidity before acting, but make the retirement-budget effect visible.
Step 8: Choose the next action from your result
If both benchmarks look weak
Verify balances and income first. Then test a higher contribution, later retirement date, lower spending plan and correct benefit start dates. Rank the changes by impact.
If the salary benchmark looks weak but the spending benchmark works
Your pension, Social Security or lower spending may explain the difference. Confirm those inputs and stress-test survivor income, healthcare and taxes before dismissing the salary benchmark entirely.
If the salary benchmark looks strong but the spending benchmark does not
Current income may understate the lifestyle you want, or reliable income may be low. Focus on the spending gap. A high salary multiple does not fund a plan whose withdrawals are too large.
If both look strong
Test poor early returns, longer life, inflation, taxes, major purchases and the timing of withdrawals. A cushion creates choices, but a benchmark cannot tell you how accounts should be invested or spent.
Retirement savings benchmark checklist
- Combine both spouses’ relevant savings and income consistently
- Exclude home equity unless the plan uses it
- Calculate current savings as a multiple of income
- Read the assumptions behind published benchmarks
- Calculate contributions as a percentage of income
- Project savings to the actual retirement date
- Test lower and middle real return assumptions
- Estimate retirement spending in today’s dollars
- Subtract reliable income with correct start dates
- Compare the projection with a personal spending checkpoint
- Choose one measurable action rather than reacting to one number
Explain your benchmarks
Use the RetireNerd Retirement Savings Benchmarks tool to compare your current savings with broad age-and-income guidelines, project the current path and calculate a personal checkpoint from retirement spending and reliable income.
Then use the RetireNerd Retirement Planner & Modeler to test investments, taxes, Social Security, withdrawals and difficult markets together.
Sources
- Fidelity: How much do I need to retire?
- T. Rowe Price: Savings benchmarks by age
- IRS: 2026 retirement-plan and IRA contribution limits
- Vanguard: Saving for retirement
RetireNerd provides educational information and simplified planning tools. This article does not provide individualized financial, investment, tax or legal advice. Benchmarks and assumptions should be reviewed in light of your circumstances.